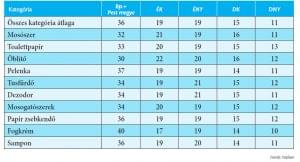
Nielsen chart of the month
Market share (in value) of the Top 10 best-selling household chemicals and cosmetics across the regions, from the 60 categories audited by Nielsen, in the December 2016 and November 2017 period (indicated in percentage). //
TOP 10 FOOD GROWTH
Tags: Nielsen
Related news

The Costa Art & Craft competition is starting!
A good coffee can do wonders – it refreshes, inspires…
Read more >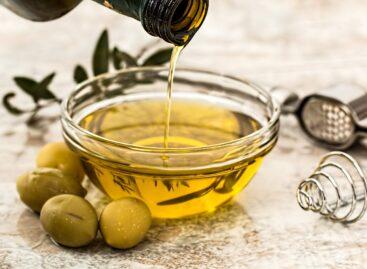
Spain’s Deoleo Sees Olive Oil Prices Staying High Until June 2024
Olive oil prices in Spain will remain at record levels…
Read more >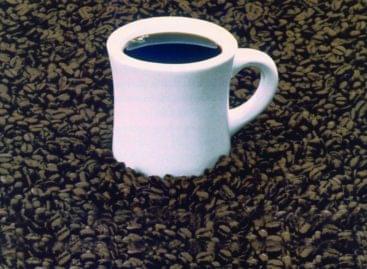
The value of the Hungarian coffee market increased by twenty percent in 2022, but the volume decreased
Due to the significant increase in the price of raw…
Read more >
More related news >
Related news

Recognition of Consumer Protection Excellence: Honoring the Best of 2024
This year’s outstanding consumer protection officers and special award recipients…
Read more >
The Joy of Giving! – SPAR stores collect non-perishable food for people in need
The Hungarian Maltese Charity Service and SPAR Hungary have launched…
Read more >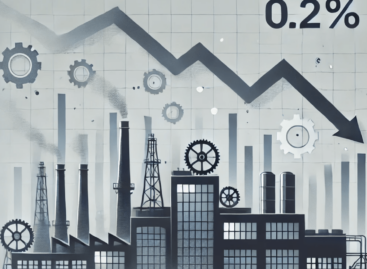
KSH: industrial production decreased by 0.2 percent in October
In October, the volume of industrial production fell by 0.2…
Read more >