Magazine: Shopper engagement study by POPAI (Part 2)
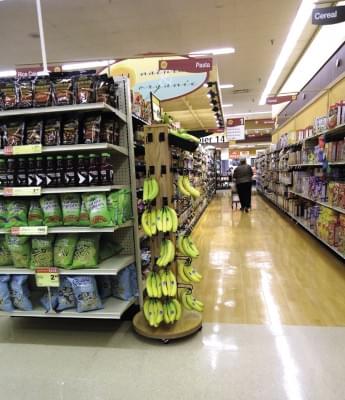
POPAI North America prepared its Shopper Engagement Study on the preferences of supermarket customers in 2012 and a Mass Merchant Channel Study on hypermarket customer habits in 2014. The results of the two surveys were compared. In connection with the 2014 survey a so-called Compliance Study was also done, with the focus on measuring the efficiency of secondary displays by examining 17 promotion campaigns. In the USA the 3 categories shoppers plan to buy the most are ready meals (75 percent), fresh fruits (74 percent) and fresh vegetables (73 percent). The least-planned are the indulgence products: newspapers and magazines (97 percent), energy drinks (85 percent) and packaged pastry (83 percent). Both categories are worth supporting with spectacular secondary displays. Despite that shoppers plan to buy certain brands in advance, these plans don’t always materialise due to the various influences customers are exposed to in-store. In the US survey Kraft had the biggest conversion rate, which was 90 percent; Kellogg’s and Purina were the runners-up at 85 percent and Colgate finished third with a 78-percent conversion rate. POPAI researchers put shoppers into 4 groups: Time Stressed, Explorer, Trip Planner and Bargain Hunter. The proportion of Time Stressed shoppers grew from 27 to 29 percent (2012 vs. 2014), Trip Planners’ proportion dropped from 24 to 22 percent, while the other two categories stayed at 23 percent and at 26 percent. Time Stressed consumers spend the most money, their average basket value is USD 54 and 83 percent of their decisions are made in-store. The same values and ratios in the other three groups: Explorer – USD 44 and 82 percent, Trip Planner – USD 48 and 8 percent, Bargain Hunter USD 39 and 81 percent. In 2014 hypermarket customers were analysed in the units of 3 large floor space retail chains and a display audit was also implemented. Back in 2012 55 percent of displays were installed where secondary product displays were, but in 2014 already 76 percent were placed at primary product displays. In 2012 52 percent of displays were floor displays, but buy 2014 their share reduced to 4 percent and gondola-end displays reigned with a 77-percent share. According to the 2014 study, displays can generate 1.5 times bigger sales. An additional study, conducted between 1 October and 15 November 2014 examined 17 promotions in 5,643 stores – supermarkets, hypermarkets, drugstores and discounters. In advance brand manufacturers and retailers were asked about the efficiency of their display promotions and the majority said they were 90-percent satisfied with it. However, things were very different in reality: only 41 percent of displays were realised at the places and in the way defined by brand manufacturers; in 17 percent of stores the researchers found some kind of secondary display but they were very different from the manufacturers’ original plans. In the remaining 42 percent of cases the promotion wasn’t realised and there was no display at all! The study also revealed that discounters are the most reliable: in 78 percent of cases everything was alright and in line with plans. Those promotions followed the original concept the most where installation and maintenance were done by store staff: 58 percent did well. Sales increase-wise hypermarkets were at the top of the ranking as 32 percent of added value was realised in this channel.
Related news
International POP events
🎧 Hallgasd a cikket: Lejátszás Szünet Folytatás Leállítás Nyelv: Auto…
Read more >Records and innovations
🎧 Hallgasd a cikket: Lejátszás Szünet Folytatás Leállítás Nyelv: Auto…
Read more >Related news
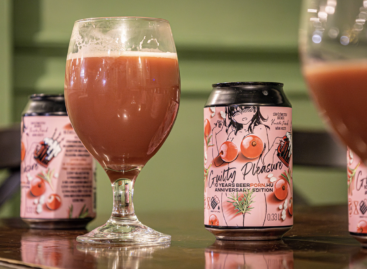
Hungarian beer magazine celebrates with rosé beer
🎧 Hallgasd a cikket: Lejátszás Szünet Folytatás Leállítás Nyelv: Auto…
Read more >(HU) Tortadíszítés-egyetem – A nap videója
🎧 Hallgasd a cikket: Lejátszás Szünet Folytatás Leállítás Nyelv: Auto…
Read more >(HU) Sajtburgermániások, ha mást esznek – A nap képe
🎧 Hallgasd a cikket: Lejátszás Szünet Folytatás Leállítás Nyelv: Auto…
Read more >