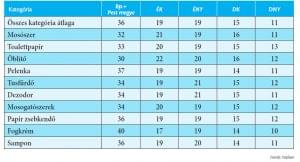
Nielsen chart of the month

Market share (in value) of the Top 10 best-selling household chemicals and cosmetics across the regions, from the 60 categories audited by Nielsen, in the December 2016 and November 2017 period (indicated in percentage). //
TOP 10 FOOD GROWTH
Tags: Nielsen
Related news
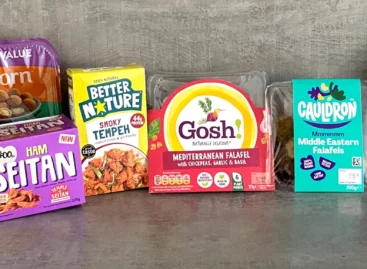
Tesco Sees Revival In Demand For Plant-Based Food Items
🎧 Hallgasd a cikket: Lejátszás Szünet Folytatás Leállítás Nyelv: Auto…
Read more >
97% Of Portuguese Prefer Physical Stores, 22% Shop Online, Study Finds
🎧 Hallgasd a cikket: Lejátszás Szünet Folytatás Leállítás Nyelv: Auto…
Read more >
The Costa Art & Craft competition is starting!
🎧 Hallgasd a cikket: Lejátszás Szünet Folytatás Leállítás Nyelv: Auto…
Read more >
More related news >
Related news

What do we spread on our bread? Young people prefer butter, older people prefer margarine
🎧 Hallgasd a cikket: Lejátszás Szünet Folytatás Leállítás Nyelv: Auto…
Read more >
Products in the EU will receive a digital passport
🎧 Hallgasd a cikket: Lejátszás Szünet Folytatás Leállítás Nyelv: Auto…
Read more >
The Hungarian sports drink manufacturer has launched three new functional drinks
🎧 Hallgasd a cikket: Lejátszás Szünet Folytatás Leállítás Nyelv: Auto…
Read more >