Industrial producer prices up by 0.4% in both euro area and EU27

In July 2012, compared with June 2012, the industrial producer price index1 rose by 0.4% in both the euro area2
(EA17) and the EU272. In June3 prices fell by 0.5% and 0.8% respectively.
In July 2012 compared with July 2011, industrial producer prices gained 1.8% in the euro area and 1.5% in the
EU27.
Monthly comparison
 In July 2012, compared with the previous month, prices in total industry excluding the energy sector rose by 0.1%
in the euro area and remained stable in the EU27. Prices in the energy sector increased by 1.6% and 1.3%
respectively. In both zones, durable consumer goods and non-durable consumer goods gained 0.2% while capital
goods remained stable. Intermediate goods fell by 0.1% in the euro area and by 0.2% in the EU27.
Among the Member States for which data are available, the highest increases in the total index were recorded in
Greece (+2.1%), Bulgaria (+1.9%) and Lithuania (+1.5%), and the largest decreases in Denmark (-1.6%),
Ireland and Sweden (both -0.8%).
Annual comparison
In July 2012 compared with July 2011, prices in total industry excluding the energy sector increased by 0.9% in the
euro area and by 1.0% in the EU27. Prices in the energy sector gained 4.8% and 2.8% respectively. Non-durable
consumer goods rose by 2.1% in the euro area and by 2.3% in the EU27. Durable consumer goods increased by
1.9% and 1.8% respectively. Capital goods increased by 1.0% in the euro area and by 1.1% in the EU27.
Intermediate goods remained stable in the euro area and rose by 0.1% in the EU27.
Among the Member States for which data are available, the largest increases in the total index were observed in
Cyprus (+6.9%), Hungary (+6.1%), Bulgaria and Romania (both +4.5%), and the smallest in Austria (+0.2%)
and Malta (+0.7%). Decreases were recorded in Denmark (-0.9%), Sweden (-0.8%) and the United Kingdom
(-0.3%).
1. The index of producer prices shows (in the national currency of the country concerned) changes in the ex-works sale prices
of all products sold on the domestic markets of the various countries, excluding imports. Euro area and EU indices refer to
overall weighted price changes. The figures are not adjusted. Missing observations from Member States for recent months
are estimated for the calculation of the euro area and the EU.
The weights of the Member States in the EU and euro area aggregates can be found at:
http://circabc.europa.eu/w/browse/b17d3ca3-51cc-44ab-92a8-433592393a61
See file: EU27_EA17_NEWS_RELEASE_WEIGHTINGS_2005_nace2
More detailed data can be found in the short-term statistics database on the Eurostat website:
http://epp.eurostat.ec.europa.eu/portal/page/portal/short_term_business_statistics/data/database
2. The euro area (EA17) includes Belgium, Germany, Estonia, Ireland, Greece, Spain, France, Italy, Cyprus, Luxembourg,
Malta, the Netherlands, Austria, Portugal, Slovenia, Slovakia and Finland.
The EU27 includes Belgium (BE), Bulgaria (BG), the Czech Republic (CZ), Denmark (DK), Germany (DE), Estonia (EE),
Ireland (IE), Greece (EL), Spain (ES), France (FR), Italy (IT), Cyprus (CY), Latvia (LV), Lithuania (LT), Luxembourg (LU),
Hungary (HU), Malta (MT), the Netherlands (NL), Austria (AT), Poland (PL), Portugal (PT), Romania (RO), Slovenia (SI),
Slovakia (SK), Finland (FI), Sweden (SE) and the United Kingdom (UK).
3. Compared with data issued in the News Release 116/2012 of 2 August 2012, the monthly and annual growth rates for June
2012 remain unchanged in both zones.

Related news
Related news

What do we spread on our bread? Young people prefer butter, older people prefer margarine
🎧 Hallgasd a cikket: Lejátszás Szünet Folytatás Leállítás Nyelv: Auto…
Read more >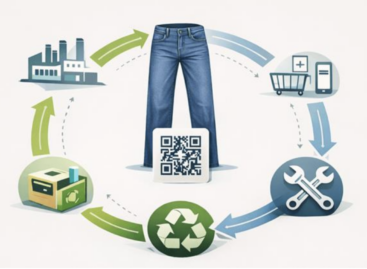
Products in the EU will receive a digital passport
🎧 Hallgasd a cikket: Lejátszás Szünet Folytatás Leállítás Nyelv: Auto…
Read more >
The season is coming, this is how student work can be successful in 2026
🎧 Hallgasd a cikket: Lejátszás Szünet Folytatás Leállítás Nyelv: Auto…
Read more >